STAT 4845 · Individual case study · 2024
From 331,423 analyzed records to a focused interactive preview.
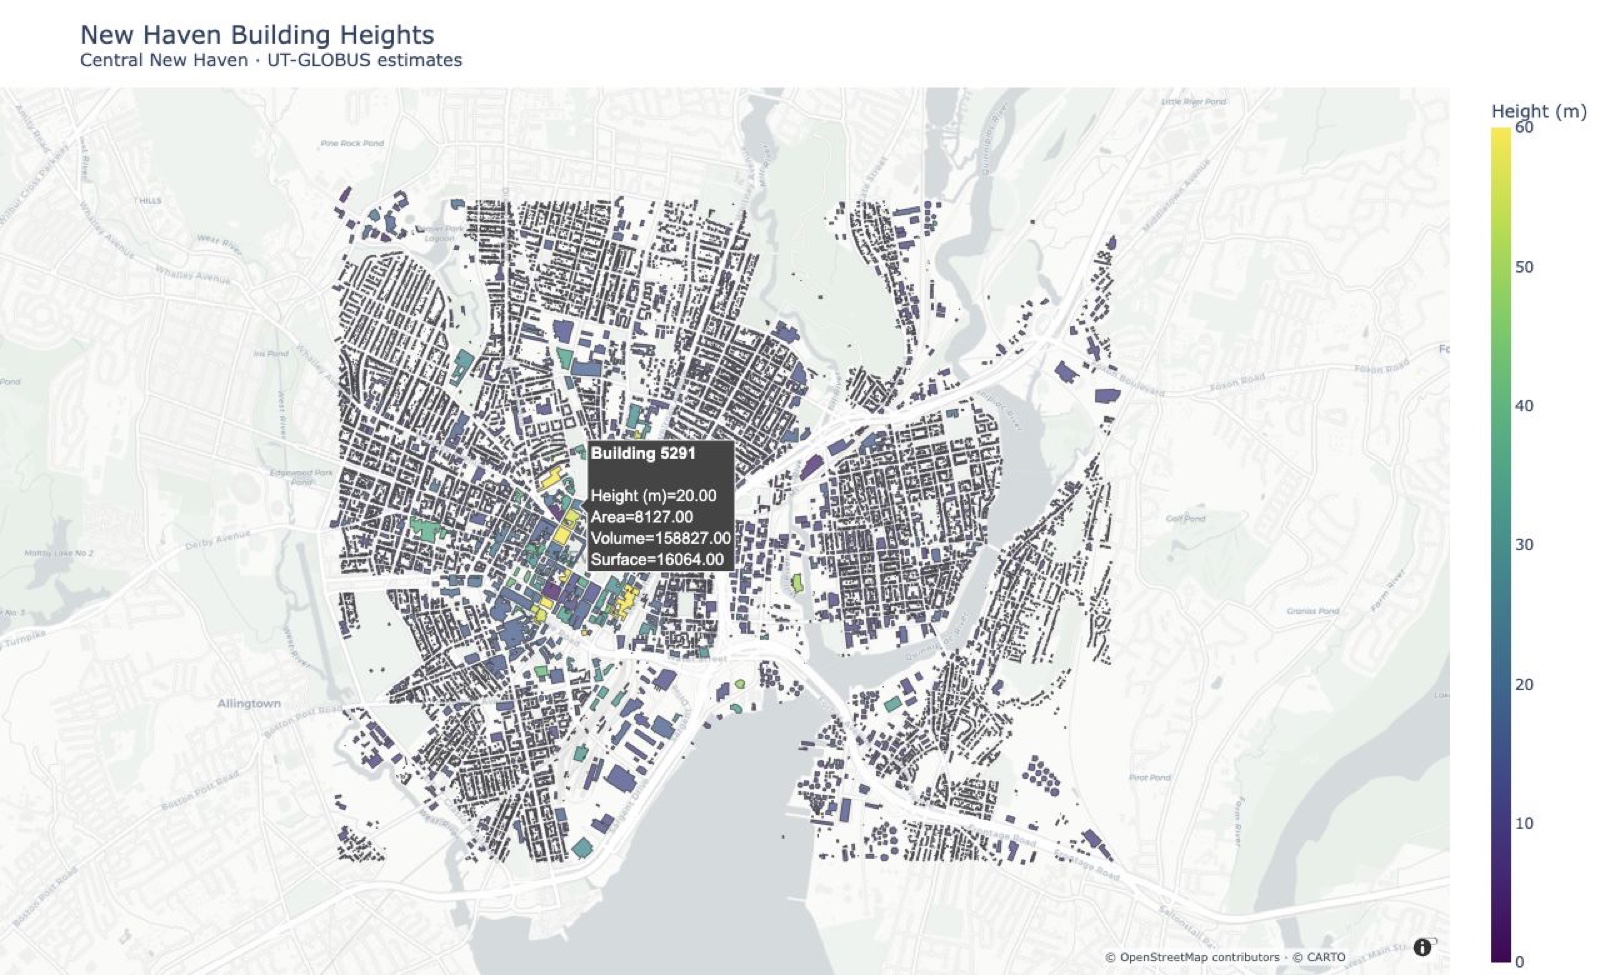
A New Haven case study combining exploratory spatial data analysis with a browser preview of 16,379 filtered central-city polygons.
01 · Problem
Urban-scale data, building-scale questions.
UT-GLOBUS provides estimated building heights and urban-form attributes at a scale useful for urban modeling. For New Haven, the working data contained hundreds of thousands of building records—too many for the original self-contained browser export to remain practical.
The project asked two connected questions: what spatial clustering appears in the height estimates, and how can people explore the data without downloading a 254 MB HTML file?
02 · Approach
Statistics and interaction, side by side.
I prepared the New Haven data, constructed K-nearest-neighbor spatial weights, evaluated global and local spatial autocorrelation, and ran a spatial-lag experiment. I also created interactive 2D building views and a rotatable 3D height visualization.
The statistical values above are archived 2024 course-project results, not a newly rerun validation. The current curated source also corrects the historical LISA display so non-significant observations are not assigned to a quadrant.
03 · Source excerpt
A smaller, reviewable map.
The revised builder selects a fixed central New Haven extent, keeps only presentation-relevant attributes, removes source IDs and coordinate fields from hover content, and loads Plotly from its CDN instead of embedding the entire library.
frame = gpd.read_file(source, layer="GLOBUS", bbox=CENTRAL_NEW_HAVEN)
frame = frame.loc[
    frame["height"].between(0, 100),
    ["height", "Area", "Volume", "Surface", "geometry"],
].reset_index(drop=True)
frame["map_id"] = frame.index.astype(str)
geometry = frame.set_index("map_id").geometry

figure = px.choropleth_mapbox(
    frame,
    geojson=json.loads(geometry.to_json()),
    locations="map_id",
    featureidkey="id",
    color="height",
    mapbox_style="carto-positron",
    opacity=0.72,
)
This excerpt communicates the selection and visualization approach without exposing local paths, raw data, or the private archival repository.
04 · Boundaries
Estimated height is not ground truth.
UT-GLOBUS is intended for urban modeling and should not be interpreted as surveyed building-level truth. Individual estimates may contain meaningful error, so this case study focuses on exploratory patterns and visualization rather than property-level claims.
The preview retains only project-relevant attributes and does not include personal data. The official UT-GLOBUS record identifies Kamath et al. as the creators and licenses the dataset under CC BY 4.0. The upstream software repository is GPL-3.0; this site does not redistribute its source code.
Explore